The Year Solar Crossed the Line
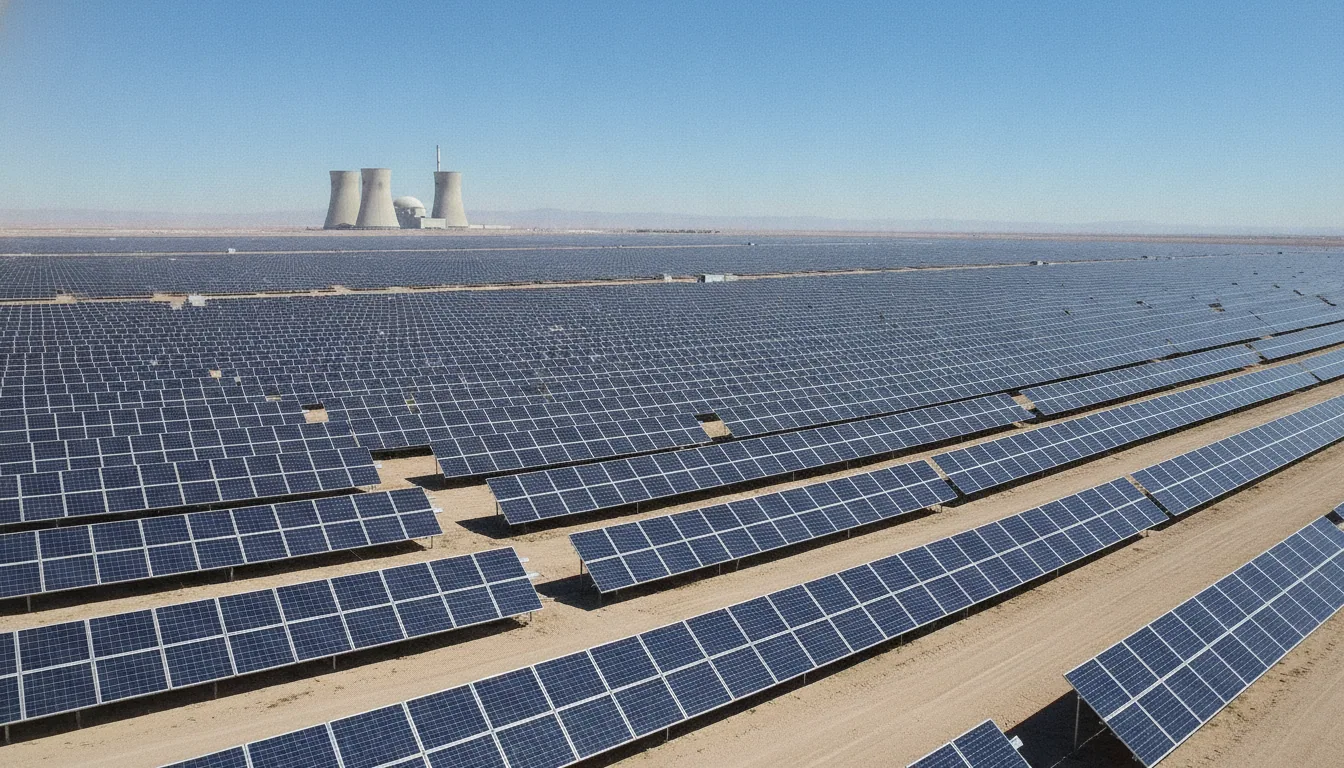
In 2025, the solar vs nuclear story reached a structural turning point — for the first time in the history of the electricity grid, solar panels generated more power globally than every nuclear reactor on earth combined. Not as a forecast. Not as a rounding-error milestone. Output rose 30 percent year on year, and the gap is now structural.
The capacity numbers make the point bluntly. Solar ended 2025 at 2,383 GW of installed capacity; nuclear sat at 399.5 GW — and actually shrank, losing 0.5 GW to retirements and outages. The ratio is roughly six to one, and it widens every quarter as new solar installations outpace anything the nuclear industry is commissioning.
Wind joined the story too. Starting in March 2025, wind power surpassed nuclear generation on a monthly basis and held that position. The World Nuclear Industry Status Report 2026 documents both crossings, and nuclear's share of global generation has now fallen to a 45-year low.
Solar alone absorbed 75 percent of new global electricity demand growth in 2025. The world consumed more power than the year before, and three-quarters of that additional consumption was covered by panels on rooftops, fields, and desert installations. That is not a gesture. That is the load curve shifting under our feet in real time.
None of this settles the larger argument about what a reliable grid requires. Capacity is not the same as generation, and a gigawatt of solar in a cloudy November is not a gigawatt of nuclear at midnight.
The milestone is real. The harder questions start here.
How the Factory Beat the Megaproject
The investment numbers from 2025 settle the industrial argument before anyone frames it. Renewables drew $690 billion in global capital; nuclear drew $70 billion. That 10-to-1 ratio is not a policy preference — it is a market verdict on which model builders, lenders, and governments actually trust with money.
The logic behind that ratio is structural. A solar panel is a manufactured product: you build a factory, improve the process, cut unit costs, and ship the output anywhere with a grid connection. China's Xinjiang Solar Farm — 5 GW commissioned in 2024 and the largest single installation on earth — is the clearest emblem of what manufacturing-scale deployment looks like when the supply chain is mature and permitting friction is low.
A nuclear plant, by contrast, is a bespoke megaproject: designed from scratch, poured in place, licensed piece by piece, and subject to every cost shock that bespoke megaprojects attract. Vogtle Units 3 and 4 in Georgia, completed in 2024, came in at $31.5 billion and an LCOE of roughly $182 per megawatt-hour; utility-scale solar sits between $29 and $92 per MWh. Those two numbers do not require commentary.
Policy has widened the gap further. The U.S. Inflation Reduction Act pays solar generators $26 per MWh in production tax credits and existing nuclear operators $15. The incentive reflects both the relative cost structures and a deliberate political bet on where the industrial momentum sits.
Nuclear's investor case is eroding in real time: Holtec, the U.S. developer most prominently associated with Small Modular Reactor ambitions, postponed its 2025 IPO citing weak investor interest. That is not a company facing a temporary headwind — it is a signal about where capital thinks the risk-adjusted returns lie.
The factory model won. The honest question now is what it still cannot do.
The Solar vs Nuclear Price Gap: Read the Full Number, Not Just the Headline
Lazard's 2024 benchmarks put unsubsidized utility-scale solar at $29 to $92 per megawatt-hour. New-build nuclear lands at $182/MWh, using Vogtle Units 3 and 4 in Georgia as the reference point. That gap is real, and it is large.
But read the full number. Vogtle 3 and 4 finished in 2024 at a total cost of $31.5 billion, roughly double the original estimate, and Georgia ratepayers are carrying that overrun in their bills. In the UK, Hinkley Point C has slipped to 2030–2031 and climbed to up to £46 billion.
These are not outliers; they are the Western nuclear cost pattern.
So the headline comparison is honest as far as it goes. Solar is cheaper to build, faster to deploy, and the price has moved in one direction for fifteen years. That's not a gesture. That's a lever.
Here is what the headline leaves out. Solar's $29/MWh figure applies when the sun is shining and the grid can absorb the output. Nuclear's $182/MWh buys power at 90 percent capacity factor, around the clock, for sixty years — dispatchable, weatherproof, land-efficient.
Those properties have real dollar value, and LCOE does not capture them.
The practical question is not which number is bigger — it is what you are buying. For a grid that needs firm, baseload carbon-free power at all hours, nuclear's cost is high but its product is distinct.
For rapid deployment at scale in sun-rich regions, solar's cost is decisive. The comparison only misleads when someone pretends it settles everything.
What Nuclear's Ledger Actually Shows
Walk into the control room of a running nuclear plant and the numbers on the wall tell a different story than the one dominating the energy headlines. A reactor holds a capacity factor between 87.7 and 92 percent — running through clouds, winters, and the dead hours between midnight and dawn when solar panels produce nothing.
A solar installation, even a well-sited one, averages a capacity factor of 20 to 30 percent. That gap is not a rounding error. It is the difference between a workhorse and a sprinter.
Land tells a similar story. Nuclear requires 17.5 acres to produce one terawatt-hour per year; solar PV requires roughly 4,942 acres for the same output — close to 280 times more. That trade-off does not make solar wrong.
It makes it a constraint that will matter — sharply — when the buildout starts competing with farmland and forest.
Then there is the climate irony. Extreme warming in Southeast Asia is projected to impair the efficiency of thermal and nuclear plants more than renewables. A reactor running hotter coolant loses output — a real vulnerability the industry has not yet priced honestly into long-term projections.
And the scorecard has a third entry: the nuclear fleet is shrinking, not growing. Operating capacity fell 0.5 gigawatts in 2025 because retirements outpaced additions. Small Modular Reactors were supposed to fix the megaproject problem — smaller, faster, cheaper.
SMR deployment in 2025 remained commercially negligible, with long construction timelines and no project yet demonstrating a balance sheet that pencils out at market prices. Holtec postponed its IPO that year, citing weak investor interest.
Nuclear's physics are still excellent. Its industrial model — the one being tested by actual construction schedules and actual invoices — is not keeping pace with the problem.
Solar scales fast and cheap; nuclear holds the grid steady at night in January.
The Grid Is Now the Bottleneck
The panel is no longer the problem. Over 1,650 gigawatts of renewable projects are sitting in grid connection queues worldwide, fully permitted and ready to generate, waiting for wires that do not yet exist.
Solar has won the cost argument. The current constraint is copper, cables, and switching stations.
Compare this to nuclear's historic position: power plants were built where the grid was, because the plants were expensive enough to justify extending infrastructure to meet them. Solar inverts that logic — cheap, modular, geographically dispersed generation arrives faster than the transmission networks designed to carry it.
The bottleneck has migrated upstream.
Grid-scale battery storage doubled in 2025, adding 104 GW globally — a real number, and a signal that the market has identified the problem and started writing checks. But 104 GW of storage against 1,650 GW of stranded generation capacity is not a solution. It is a down payment.
This is where the clean energy infrastructure comparison sharpens rather than fades. A nuclear plant delivers firm, schedulable power to a known point on the grid, hour after hour, at a capacity factor near 90 percent. A solar farm delivering power intermittently into an undersized grid is not yet a substitute for that function, whatever its LCOE says.
The physics of a running plant still beat the economics of an unconnected one.
Solar's lead is real and will likely grow. But it depends entirely on parallel investment in storage and transmission — not as a nice addition, but as the precondition.
The Honest Scorecard: Two Technologies, One Grid, No Simple Answer
Public risk perception has never been a reliable guide on solar and nuclear energy. Research published in Risk Analysis shows that people systematically rate nuclear as more dangerous than solar, even though operational nuclear has one of the lowest deaths-per-terawatt-hour records of any energy source. The same perception gap understates solar's real costs: land use at roughly 280 times more acreage per TWh than nuclear, and intermittency that no amount of panel cost reduction resolves on its own.
The 2025 milestone is real. Solar output rose 30 percent, met 75 percent of new electricity demand growth globally, and did so at an unsubsidized LCOE starting at $29 per megawatt-hour.
Nuclear's new-build cost sits at $182 per megawatt-hour, and its global operating capacity actually shrank by 0.5 GW last year. Those numbers do not lie.
But solar's constraint is no longer price. It is the 1,650 GW of renewable projects stalled in grid connection queues worldwide, and a storage buildout that, even after doubling to 104 GW in 2025, is nowhere near sufficient to replace nuclear's 90 percent capacity factor in regions with weak solar resources or heavy winter loads.
The productive question in the solar vs nuclear debate was never which source wins. Solar scales fast and cheap; nuclear holds the grid steady at night in January.
The scorecard says: clear the connection queues, fund storage seriously, and keep the operating nuclear fleet running while solar earns its way to dominance. That is not a compromise. It is arithmetic.